A recent review [Doerge, Zeng, and WeirDoerge et al.1997] summarizes the statistical issues for mapping QTLs. It is the best place to start for a general overview of the analytical methods used in QTL Cartographer.
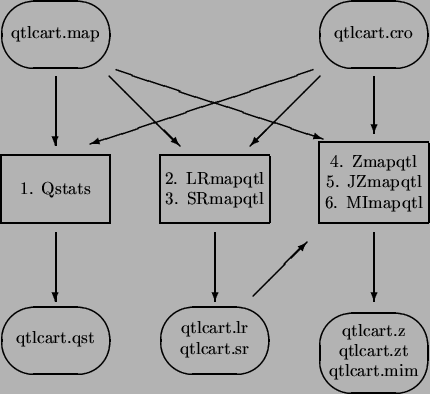
Figure 3.1 shows a schematic of the analysis procedure. There are five programs in this step. Qstats does some basic quantitative genetic statistics and summarizes missing data. It is a useful program to run at the beginning of your analysis. LRmapqtl does single maker analysis using linear regression. It also runs very fast and will give some idea of where QTLs are. SRmapqtl does stepwise regression, either forward, backward or forward with backward elimination. The program Zmapqtl implements interval mapping [Lander and BotsteinLander and Botstein1989] and composite interval mapping [ZengZeng1993,ZengZeng1994] for a single trait at a time. JZmapqtl is an extension to multitrait mapping [Jiang and ZengJiang and Zeng1995]. Multiple interval mapping [Kao and ZengKao and Zeng1997,Kao, Zeng, and TeasdaleKao et al.1999,Zeng, Kao, and BastenZeng et al.1999] is available in MImapqtl.
The basic requirements for using these three programs is a genetic linkage map and a data file. The linkage map should be of filetype format ``Rmap.out'' and the data file of ``Rcross.out''. Whether the files are simulated, real or bootstrapped data is irrelevant: The analysis is the same regardless of the origin of the data.