Qstats is a good place to start in analyzing your data. It computes
some basic statistics on the quantitative traits and summarizes missing
data.
Let
![]() be a vector of quantitative trait values. For each trait in turn, it calculates the
sample size (n),
mean (
be a vector of quantitative trait values. For each trait in turn, it calculates the
sample size (n),
mean (
![]() ),
variance (
),
variance (
![]() ),
standard deviation (
),
standard deviation (
![]() ),
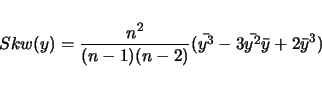
skewness,
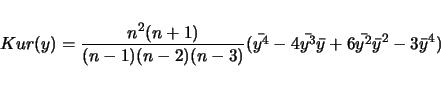
kurtosis and average deviation,
),
skewness,
kurtosis and average deviation,
![]() . The coefficient of variation is the
sample standard deviation divided by the sample mean.
. The coefficient of variation is the
sample standard deviation divided by the sample mean.
lynchwalsh@98 provide a lucid explanation of some of the
statistics calculated by Qstats.
Let the ![]() th sample moment be
th sample moment be
![]() . Clearly,
. Clearly,
![]() . Using the notation
. Using the notation
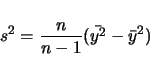
![]() , we can estimate the
sample variance with
, we can estimate the
sample variance with

An example of the output follows:
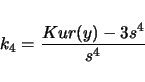
 ------------------------------------------------------
 ------------------------------------------------------
 	This is for -trait 1 called szfreq
 ------------------------------------------------------
 		Sample Size................           119
 		M(1).......................        0.4349
 		M(2).......................        0.2184
 		M(3).......................        0.1195
 		M(4).......................        0.0694
 		Mean Trait Value...........        0.4349
 		Variance...................        0.0295
 		Standard Deviation.........        0.1718
 		Coefficient of Variation...        0.3951
 		Average Deviation..........        0.1398
 		Skw..LW(24)................       -0.0010
 		.....Sqrt(6/n).............        0.2245
 		Kur..LW(29)................        0.0022
 		.....Sqrt(24/n)............        0.4491
 		k3...LW(24)................       -0.1922
 		k4...LW(28)................       -0.5250
 		S (5%: 5.99, 1%: 9.21).....        2.0992
 ------------------------------------------------------
 ------------------------------------------------------
In the above example, LW(i) refers to a page number in lynchwalsh@98 where one can find an explanation of the quantity. The value of the test statistic
After the basic statistics, Qstats draws a histogram of the quantitative trait. It is a simple histogram in that the range of the data are divided into 50 equally sized bins, and the number of data points falling into each bin are counted and plotted. A small table following the histogram gives the sample size, minimum, first quartile, median, second quartile and maximum.