Next: Models
Up: Zmapqtl
Previous: Zmapqtl
Contents
Index
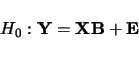
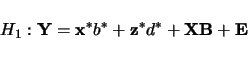
Composite interval mapping [ZengZeng1993,ZengZeng1994] combines
interval mapping with multiple regression. The statistical model is defined as
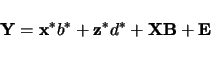 |
(3.5) |
where
 is a vector of trait values
 and
and  are the additive and dominance effects of the
putative QTL being tested
are the additive and dominance effects of the
putative QTL being tested
-
 and
and
 are indicator variable vectors
specifying the probabilities of an individual being in different genotypes for
the putative QTL constructed by flanking makers
are indicator variable vectors
specifying the probabilities of an individual being in different genotypes for
the putative QTL constructed by flanking makers
 is the vector of effects of other selected markers fitted in
the model
is the vector of effects of other selected markers fitted in
the model
 is the marker information matrix for those selected markers
 is the error vector.
Estimates of the parameters are obtained by maximum likelihood through an ECM
(for Expectation/Conditional Maximization) algorithm [Meng and RubinMeng and
Rubin1993]. In each
E-step, the probability of an individual being in different genotypes of the
putative QTL is updated. In the CM-step, the estimation of parameters
and is separated from that of , and each group is estimated
conditional on the others. This procedure is implemented for numerical
consideration. As
and
are separated from
, is unchanged in each iteration, and its costly
recalculation is avoided.
For an  population, the hypotheses for testing are
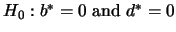 and
and
 . This is performed through a likelihood ratio test procedure. In
addition, it is possible to test hypotheses on and
individually. For a backcross data set, dominance cannot be estimated and
is dropped from Equation 3.5.
. This is performed through a likelihood ratio test procedure. In
addition, it is possible to test hypotheses on and
individually. For a backcross data set, dominance cannot be estimated and
is dropped from Equation 3.5.
The trait will have a variance  . Under the null hypothesis
the sample variance of the residuals will be  . For a given
alternative model, say
. For a given
alternative model, say
the variance of the residuals would be  . With this in mind we can
calculate the proportion of variance explained by a QTL at the test site.
The quantity is usually called
. With this in mind we can
calculate the proportion of variance explained by a QTL at the test site.
The quantity is usually called  and estimated by
An alternative estimate would use the total variance. Denote it by
is the proportion of the variance explained by the QTL conditioned on the
background markers and any explanatory variables.  is the proportion of the
total variance explained by the QTL and the the background markers and any explanatory
variables. Generally,
is the proportion of the
total variance explained by the QTL and the the background markers and any explanatory
variables. Generally,

Next: Models
Up: Zmapqtl
Previous: Zmapqtl
Contents
Index
Christopher Basten
2002-03-27