The first phase in using QTL Cartographer is to create some data. You have two options for this: You can either simulate a data set or collect one yourself. The end result will be to have two files. One will contain the information on a genetic linkage map (marker order, chromosome assignment and recombination fractions) and the other a data set from a cross, which contains the markers, trait values and other explanatory variables. QTL Cartographer cannot create a genetic linkage map from a data set: You will have to use another program such as Mapmaker/EXP for that task.
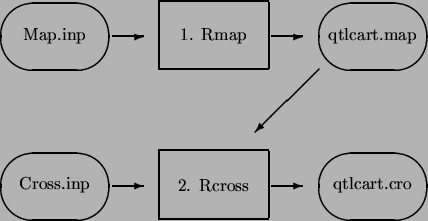
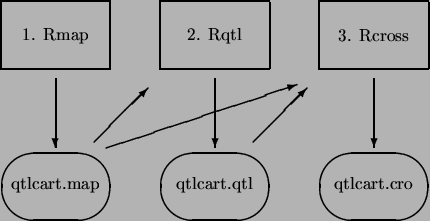
Figures 2.1-2.2 present a schematic of the data simulation/reformatting process. There are four main programs involved in this phase: Rmap, Rqtl, Rcross and Prune. Rmap is a program designed to create random genetic linkage maps, or reformat linkage maps that were prepared by Mapmaker/EXP. Rqtl is a program that creates a genetic model for simulation. One can specify the positions, effects and the number of loci for each trait, or have the program do it randomly. Finally, Rcross uses the genetic linkage map and the model to create a random data set, by simulating a cross. Rcross can also reformat Mapmaker/QTL raw data files or specially formatted data files. The fourth member of this group is Prune. With Prune, the user can eliminate individuals, markers or traits from the data set. In addition, Prune allows one to bootstrap or permute the data, as well as to simulate missing or dominant markers.
Regardless of whether the data are simulated or real, the important output files from this step are the genetic linkage map and the data set. We will refer to these files as qtlcart.map and qtlcart.cro, although you can name them anything you like. In fact, we generally decide on a filename stem and use filename extensions to indicate what is in the various files. If we were working on a corn data set, we might have files corn.map and corn.cro for the genetic linkage map and marker/trait data set, respectively. The naming scheme would be consistent throughout the analysis.
One note on the behavior of Rmap, Rqtl and Rcross: If you choose to translate a data file, then the parameters for simulations are unnecessary and they disappear from the interactive menu. If you specify no input file for any of these programs (by entering a period ``.'' all by itself for the input filename), then the simulation parameters will reappear for the user to change.