Next: Translating Data
Up: Simulating Data
Previous: Generation of Individuals
Contents
Index
Phenotypic values are calculated from the genotypic values for
each individual
for each trait. Each individual's phenotypic value is calculated
from its genotypic value with an
environmental effect determined by the heritability  . The
individual's genotypic value is based on the alleles it inherited at the quantitative
trait loci. To calculate genetic values, we use Cockerham's general genetic model
[CockerhamCockerham1954].
. The
individual's genotypic value is based on the alleles it inherited at the quantitative
trait loci. To calculate genetic values, we use Cockerham's general genetic model
[CockerhamCockerham1954].
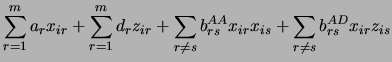
The parameters  are the additive and dominance effects of QTL
  . The
. The  's are epistatic interactions.
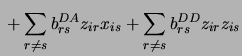
The superscripts on the 's are for the type of interaction: We distinguish between additive by additive (AA), additive by dominance (AD),
dominance by additive (DA) and dominance by dominance (DD) interactions. The
's are epistatic interactions.
The superscripts on the 's are for the type of interaction: We distinguish between additive by additive (AA), additive by dominance (AD),
dominance by additive (DA) and dominance by dominance (DD) interactions. The  and
and  are coded variables denoting the
genotype of the QTL. The
are coded variables denoting the
genotype of the QTL. The  take on values
 for QTL genotypes
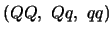 , while
the
, while
the  are
are  for heterozygotes and
  for homozygotes.
This results in a vector of genotypic values, one entry per individual
in the simulated data set. The genetic variance is the sample
variance of this vector of genotypic values. Call it  . The
environmental variance,
. The
environmental variance,  is defined by
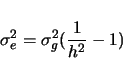 |
(2.9) |
where is the heritability of the trait.
The extra environmental effect is
taken from a normal distribution with mean 0 and variance .
If the environmental variance is specified, the heritability is
ignored and the environmental variance is used directly. For each individual
in the data set, a random variable with mean zero and variance
is generated and added to the genotypic value. This is the phenotypic
value of that individual, and is printed in the output file.
Next: Translating Data
Up: Simulating Data
Previous: Generation of Individuals
Contents
Index
Christopher Basten
2002-03-27