The final step in analyzing your data will be to summarize your results, either graphically or as a compact set of estimates for QTL positions and effects. We have provided some utilities that read the output of the analysis programs and reformat it for use in graphics packages. The freeware program Gnuplot is recommended as a graphics engine, but the results could be plotted in any plotting package on any machine. All of the results from the analysis programs are simple text files, and all the reformatted files are also simple text.
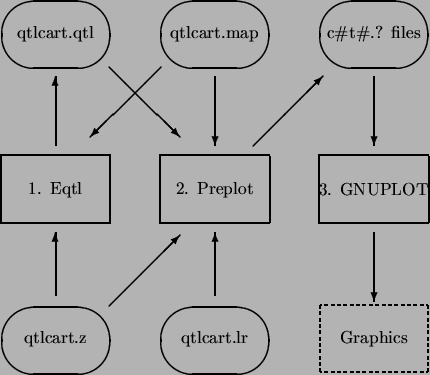
Figure 4.1 is a schematic of the programs and files that are involved in this step. Eqtl is a utility that quickly picks out the possible QTLs from the results of Zmapqtl. Preplot can read the output of Rqtl, LRmapqtl, Zmapqtl, MImapqtl and Eqtl and produce simple files containing two columns of text corresponding to the values for the abscissa and ordinate of a plot. These files in turn can be plotted by Gnuplot, or imported into various plotting packages on various platforms.