Eqtl essentially finds the peaks in the likelihood ratio graph of the results from Zmapqtl. It
goes along the chromosome, and determines whether the likelihood ratio test
statistic is increasing or decreasing. Upon a change, it picks out the position
and estimates of other parameters. The user can specify that the peaks of
interest need be higher than some ``Significance threshold'' to be considered QTLs.
The default is 3.84, that is, any peak that is less than 3.84 is ignored. This
can be changed with the -S option. If you have run Zmapqtl and done a
permutation test,
Eqtl automatically reads the output and sets the significance threshold subject to
the value of the size, set with the -a option. For a size of ![]() , the
the
, the
the ![]() -percentile is calculated from the experimentwise test values.
-percentile is calculated from the experimentwise test values.
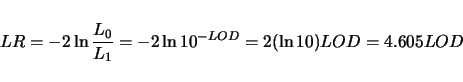
The final option is a flag to output LOD scores rather than likelihood ratios. The default
behavior of the QTL Cartographer system is to use a likelihood ratio test statistic (LR)
rather than a LOD score. For a hypotheses ![]() , let
, let ![]() be the
likelihood of the data given the hypothesis. For a pair of hypotheses
be the
likelihood of the data given the hypothesis. For a pair of hypotheses ![]() and
and ![]() , this
would yield
, this
would yield ![]() and
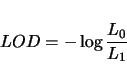
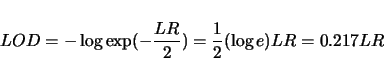
and ![]() . The LOD score is defined as
. The LOD score is defined as