The paradigm for the programs in the QTL Cartographer package is that of highly
inbred lines with very little genetic variation within lines but variation
between lines. We shall refer to these inbred lines as parental lines and denote
them by the symbols ![]() and
and ![]() . As a general rule, the
. As a general rule, the ![]() lines will
correspond to the ``high'' lines with respect to the trait of interest, that is
they will have mean values larger than the
lines will
correspond to the ``high'' lines with respect to the trait of interest, that is
they will have mean values larger than the ![]() or ``low'' lines. These
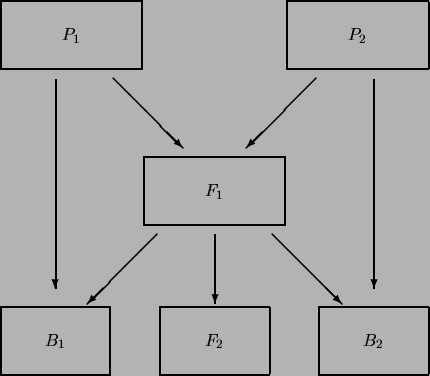
parental lines can be crossed to produce
or ``low'' lines. These
parental lines can be crossed to produce ![]() lines which are heterozygous
for both markers and QTLs. One can then cross the
lines which are heterozygous
for both markers and QTLs. One can then cross the ![]() populations with either parental line to produce backcrosses. The symbols
populations with either parental line to produce backcrosses. The symbols ![]() and
and ![]() will refer to backcrosses involving the
will refer to backcrosses involving the ![]() and
and ![]() lines,
respectively. Alternatively, the
lines,
respectively. Alternatively, the ![]() lines can be intercrossed to produce
lines can be intercrossed to produce
![]() lines.
lines.
In each of these cases, the resultant lines will have variation in both the trait of interest and the underlying quantitative trait loci and marker genotypes. These crosses are illustrated in Figure 1.1. We can then look for correlations between the trait in question and marker genes that have been mapped previously.
We have also included options for more complex experimental designs, including
recombinant inbred lines, general ![]() lines produced by selfing or random crossing of
lines produced by selfing or random crossing of
![]() lines, etc. The programs in the QTL Cartographer system will need to know the type of experimental design used to
create the data. This design is encoded by a string of characters. If the letter
lines, etc. The programs in the QTL Cartographer system will need to know the type of experimental design used to
create the data. This design is encoded by a string of characters. If the letter ![]() stands for some integer, then the
possible crosses will be
stands for some integer, then the
possible crosses will be ![]() ,
, ![]() ,
, ![]() ,
, ![]() ,
, ![]() and
and ![]() . The B stands for a backcross
and the integer attached to it will indicate the parental line to which the
. The B stands for a backcross
and the integer attached to it will indicate the parental line to which the ![]() line was crossed to (either 1 or 2). If
there was repeated
backcrossing to one of the parental lines, this can be indicated by attaching two integers
to the B:
line was crossed to (either 1 or 2). If
there was repeated
backcrossing to one of the parental lines, this can be indicated by attaching two integers
to the B: ![]() indicates that there were
indicates that there were ![]() generations of backcrossing to parental line
generations of backcrossing to parental line ![]() .
.
![]() is equivalent to
is equivalent to ![]() .
. ![]() stands for selfed intercross
lines and the integer indicates the generation
stands for selfed intercross
lines and the integer indicates the generation
![]() .
. ![]() stands for randomly mated intercross lines. RI means
recombinant inbred lines, and the integer can take on one of three values: 0, 1, and
2. A 1 indicates RI lines derived by selfing, a 2 by sib mating and a 0 means
doubled haploid lines.
stands for randomly mated intercross lines. RI means
recombinant inbred lines, and the integer can take on one of three values: 0, 1, and
2. A 1 indicates RI lines derived by selfing, a 2 by sib mating and a 0 means
doubled haploid lines.
The T indicates that the data are the result of a test
cross. For a test cross, genotyping is done on an intercross (![]() or
or ![]() ) and
phenotyping on a cross derived from that intercross. The first part of the string, T(XX)
indicates that phenotyping is done on the XX population and the second part (
) and
phenotyping on a cross derived from that intercross. The first part of the string, T(XX)
indicates that phenotyping is done on the XX population and the second part (![]() or
or
![]() ) indicates the genotyped population. XX can be a
) indicates the genotyped population. XX can be a ![]() ,
, ![]() ,
, ![]() or
or ![]() for
for ![]() lines or
lines or ![]() or
or ![]() for
for ![]() lines.
lines. ![]() stands for Design III experiments
[Cockerham and ZengCockerham and
Zeng1996].
stands for Design III experiments
[Cockerham and ZengCockerham and
Zeng1996].
All of the above experimental designs can be simulated, and all but the Design III experiments can be analyzed. Table 1.1 lists all the experimental designs and their QTL Cartographer codes. The experimental designs of Table 1.1 can be specified in Rcross for simulations or in certain data input files (see Section 6.3.2).