|
Single-marker analysis
|
Previous Top Next |
| 1. | Open a mapping source data file (an .MCD file) into the WinQTLCart main window.
|
|
|
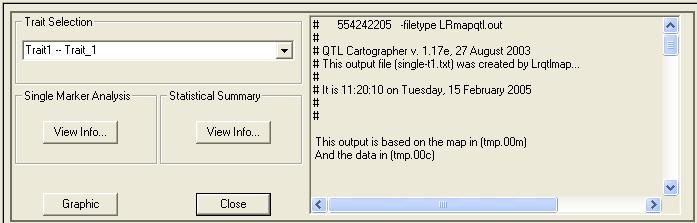
| 2. | Select Method>Single-Marker Analysis. WinQTLCart analyzes the data and displays the single-marker analysis controls in the form pane. The information pane on the right includes the analysis results.
|
|
|
|
|
|
|
| 3. | Select a trait for display from the Trait Selection pull-down list. All the traits present in the file will be on the list.
|
|
|
| 4. | For each trait, the information pane on the right displays WinQTLCart's statistical summary of the file. (You can view this summary in a larger window by clicking the Result button in the Statistical Summary group box, just to the left of the information pane.)
|
|
|
| 5. | In the Single Marker Analysis group box, click Result to view the analysis result for the selected trait. You can change the font used by the display window to make the results easier to read. Click the Save… button in this group to save the marker analysis results to a text file.
|
|
|
| 6. | In the Statistical Summary group box, click Result to view the summary in a larger display window. Click the Save… button to save the statistical results to a text file.
|
| The statistical summary includes:
|
| · | Basic summary of the data
|
| · | A histogram for the quantitative trait
|
| · | WinQTLCart's summary of missing individuals that should be present, as indicated by the data. If markers show 0% data, there was likely an import problem.
|
| · | Summary of marker segregation
|
| · | Combines LR map QTL and Q stats
|
| 7. | Click the Graphic File… button to save the results to a QTL mapping result file (*.QRT). You can open this .QRT file later to view the results as a graph.
|
|
|
| 8. | Click Close to end the single-marker analysis session and return to the Form View of Source Data.
|
| · | Tells you that the data were imported correctly. If a marker has 0% data, that indicates a problem (likely an import problem). For example, the original marker may be *Marker_1, but QTL sees that as *Marker-1, and the values won't match.
|
| · | Tests for segregation distortion
|