|
Running composite interval mapping analysis
|
Previous Top Next |
| 1. | Open a source data file into the WinQTLCart main window.
|
|
|
| 2. | Select Method>Composite Interval Mapping. WinQTLCart displays the CIM analysis controls in the form pane.
|
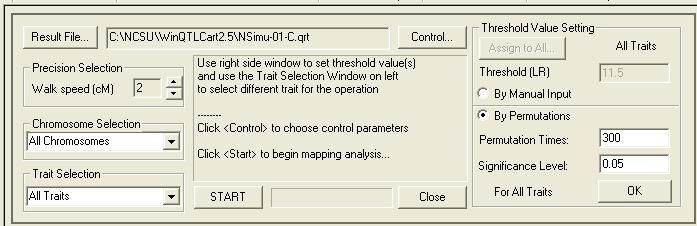
| 3. | Click Result File… to select the .QRT file you want to create.
|
|
|
| 4. | Click the Control… button to display the Set CIM Control Parameters dialog.
|

| 4a. | For the CIM Model field, specify the markers to be used as cofactors in the CIM analysis:
|
| · | Model 1: All Marker Control—Use all the markers to control for the genetic background.
|
| · | Model 2: Unlinked Marker Control—Use all unlinked markers to control for the genetic background.
|
| · | Model 4: One Marker Control—This is an ad-hoc model. One marker from each chromosome (except for the chromosome on which we are testing) is used to control for the genetic background. The results of LRmapqtl are scanned, and the marker that showed the highest test statistic from each chromosome is used.
|
| · | Model 5: Two Marker Control—Another ad-hoc model. Two markers from each chromosome are used to control for the genetic background. They are the top two markers as determined by LRmapqtl. In addition, all the other markers on the chromosome of the test position that are more than 10 cM away from the flanking markers are also thrown in. It may be ad-hoc, but tends to work best at this time. Selecting this model also requires you to fill in the Window size (cM) field (explained below).
|
| · | Model 6: Standard Model—The default model that selects certain markers as control markers by using additional parameters: control marker number and window size. Selecting this model requires you to fill in extra fields on the dialog: Control marker numbers, Window size (cM), and Regression method selection (all explained below).
|
|
|
| 4b. Click Set control markers manually if you do not want WinQTLCart to automatically select the control markers. This will display a dialog box after you start the analysis so that you can manually select the control markers. Skip to step 10 for a description of this dialog box.
|
| The Background Controls group box specifies the number of background controls and regression type WinQTLCart should use in applying the selected CIM model.
|
| 4c. | Control marker numbers—Enter the number of markers to control for the genetic background. WinQTLCart will use up to the number of markers entered here.
|
|
|
| 4d. | Window size (cM)—Enter the window size in centiMorgans. The window size will block out a region of the genome on either side of the markers flanking the test site. Since these flanking regions are tightly linked to the testing site, if we were to use them as background markers we would then be eliminating the signal from the test site itself.
|
|
If the control marker number is…
|
And if the window size is…
|
This is the result
|
|
The total number of markers
|
0.0
|
Model 6 reduces to Model 1
|
|
The total number of markers
|
Large (such as the size of the largest chromosome)
|
Model 2
|
|
Zero
|
N/a
|
Model 3
|
| Recommendations
|
| · | Model 6 is good for starting an analysis. Start with the default values of 5 for control markers and 10 for window size.
|
| · | Increasing the number of control markers will allow better resolution for mapping linked QTLs.
|
|
|
| 4e. | Regression method selection—Select a method.
|
| · | 1: Forward Regression
|
| · | 2: Backward Regression
|
| · | 3: Forward & Backward
|
|
|
| 4f. Probability for into:, Probability for out:
|
|
|
| 4g. If the OTrait number field is enabled, enter other trait numbers and their ranges to be included in the model.
|
| Note | OTraits is another term for "categorical traits." Use QTraits for background control as nuisance factors we want to account for.
|
| 4h. | Click OK to close the dialog and return to the CIM analysis form.
|
| 5. | The Walk speed (cM) default is 2. The walk speed is the genome scan interval. Click the spin dial beside the Walk speed value to increase or decrease the walk speed by .5 increments.
|
| · | Increasing the walk speed (greater than 2) means less precision but the analysis takes less time.
|
| · | Decreasing the walk speed (less than 2) yields a more precise result but will take more time.
|
| You should set the walk speed value once for the entire dataset. A single walk speed establishes a consistent norm against which the data can be graphed. If you change the walk speed between runs, the graph displays will be skewed. (If you want to check your data against a different walk speed, create a separate directory for your data files, and then run the new walk speed against those files.)
|
| 6. | Select one or all chromosomes to include in the analysis.
|
| 7. | Select one or all traits to include in the analysis. The Traits you select may change the value of the Threshold controls on the right side of the form.
|
|
|
| 8. | Set the threshold level via either manual input or permutations. For more information, see Setting threshold levels (IM & CIM).
|
|
|
| 9. | Click Start to begin QTL mapping analysis. WinQTLCart will open a Save As dialog for you to save the result file that will be created.
|
| 10. | If you selected Set control markers manually in step 4b, then WinQTLCart will display the Select CIM Control Markers dialog box. Enter or edit the marker numbers you want to using the text box; separate each number with a space. Click on the marker row's cells to toggle their display in the text box.
|
| · | Create a QTL mapping result file (*.QRT) and open it in the Graph window
|
| · | Create a QTL summary information file using the EQTL function.
|
| · | Display a confirmation box asking if you want to display QTL summary information in the Main window's Data pane.
|