|
Graph window - Procedures
|
Previous Top Next |
| · | Spot the location of QTLs. A graph peak that extends past the threshold line is the site of a QTL.
|
| · | Load multiple results files at one time and compare them. This could be useful when comparing the results of the same dataset pushed through different analysis methods and parameters.
|
|
|
|
|
|
|
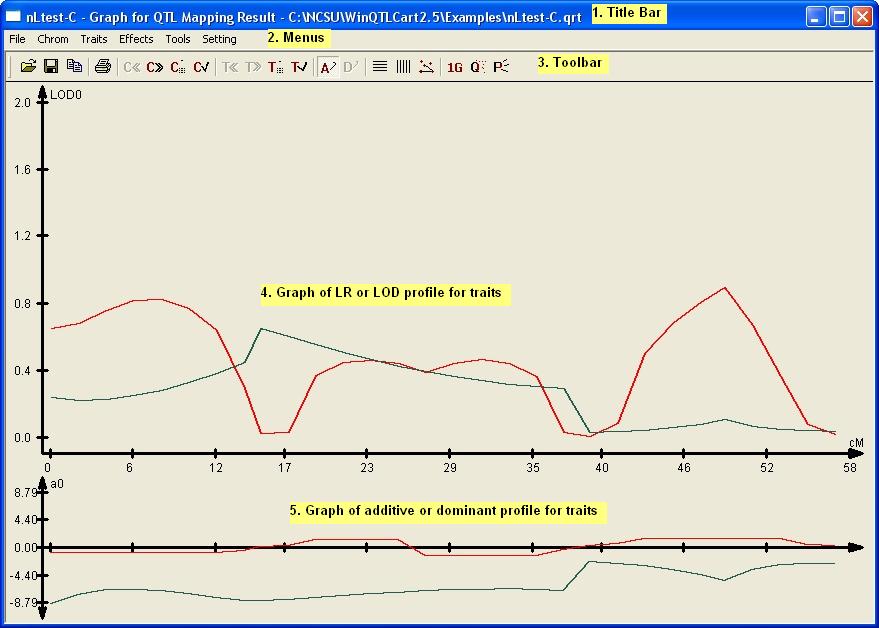
| 1. | Title bar. Shows the name of the selected results data file. You can have multiple results files loaded and multiple Graph windows open at a time.
|
| 2. | Menu bar
|
| 3. | Toolbar with one-click access to the program's major functions. Hover the pointer over a button to see a brief description of that command.
|
| 4. | The large graph charts the data as a LOD score. The higher the LOD, the greater the evidence for a QTL.
|
| 5. | The smaller graph at the bottom is the QTL effects window, showing either the additive or dominant effects.
|
| · | You can add several result files so they display at the same time on the current graph. You might want to run your data through the IM, CIM, and MIM analysis methods, for example, and then pull them all into the same graph to see how they compare.
|
| · | Peaks above the threshold line indicate a QTL.
|
| · | A high LOD number on the graph indicates a good QTL candidate.
|
| · | Right-click on the graph to see appropriate commands. (Commands described in the Graph window-Menus topic.)
|
| · | You can minimize the Graph window to the bottom of the Main window; a small bit of the title bar is visible.
|
| · | You can have the same result file open in several windows at the same time. This might be useful if you're testing various viewing parameters. To do this, minimize the current Graph window, go back to the Main window, ensure the result file is still active, and click the Graph toolbar button.
|