From the Main window, with a source data file loaded, select Tools>DrawChrom to show the Chromosome Graphic Display window.
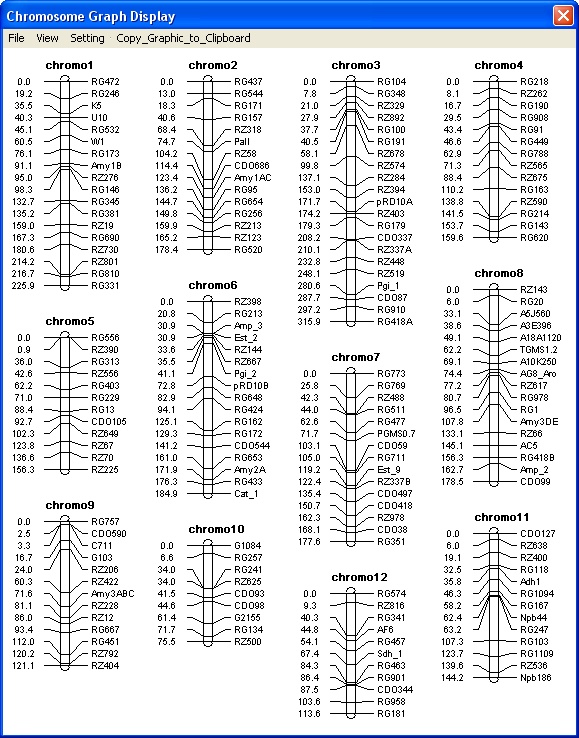
This sample graphic shows you the chromosome names, the markers on the chromosomes, and their distances.
|
Chromosome Graphic Display menus
| |
|
File menu
|
|
|
Command
|
Function
|
|
Copy to Clipboard
|
Copies the graphs to the Windows clipboard.
|
|
Print Graphic
|
Print the graphic to a selected printer.
|
|
Exit
|
Closes the window. If you have unsaved data, you'll be prompted to save it.
|
|
View menu
|
|
|
Command
|
Function
|
|
Proportion of Marker Number
|
Show length of chromosome graph in proportion of marker number
|
|
Proportion of Chromosome Len
|
Show length of chromosome graph in proportion of chromosome length in cM
|
|
Next Page >>
|
If there are lots of chromosomes, displays the next group of graphs
|
|
First Page
|
If there are more than one screen of chromosomes, return to the first page.
|
|
Add QTL positions…
|
Mark a QTL position on the chromosome. See Adding QTL positions to the chromosome graphics for more information.
|
|
Setting menu
|
|
|
Command
|
Function
|
|
Select Chromosomes…
|
Select the chromosomes you want displayed in the graphic.
|
|
Show Chromosome Name
|
Toggle between showing the chromosome name or its label
|
|
Font Size >>
|
Increase font size for graph
|
|
Font Size <<
|
Decrease font size for graph
|
|
Space Between >>
|
Increase the space between markers (graph gets longer)
|
|
Space Between <<
|
Decrease the space between markers (graph gets shorter)
|
|
Chromosome Name>>
|
Go to the next chromosome in the series
|
|
Chromosome Name<<
|
Go to the previous chromosome in the series
|
|
Column Number >>
|
Increase number of graphics displayed in a column
|
|
Column Number <<
|
Decrease number of graphics displayed in a column
|